I’m new to PSADT, just started testing it today (the 4.0.6 and 4.1 versions).
One big issue I noticed is that the startup of Invoke-AppDeployToolkit.exe is pretty long, around 15 seconds. That is time between launching the exe file and getting the PSADT GUI popup and installation start.
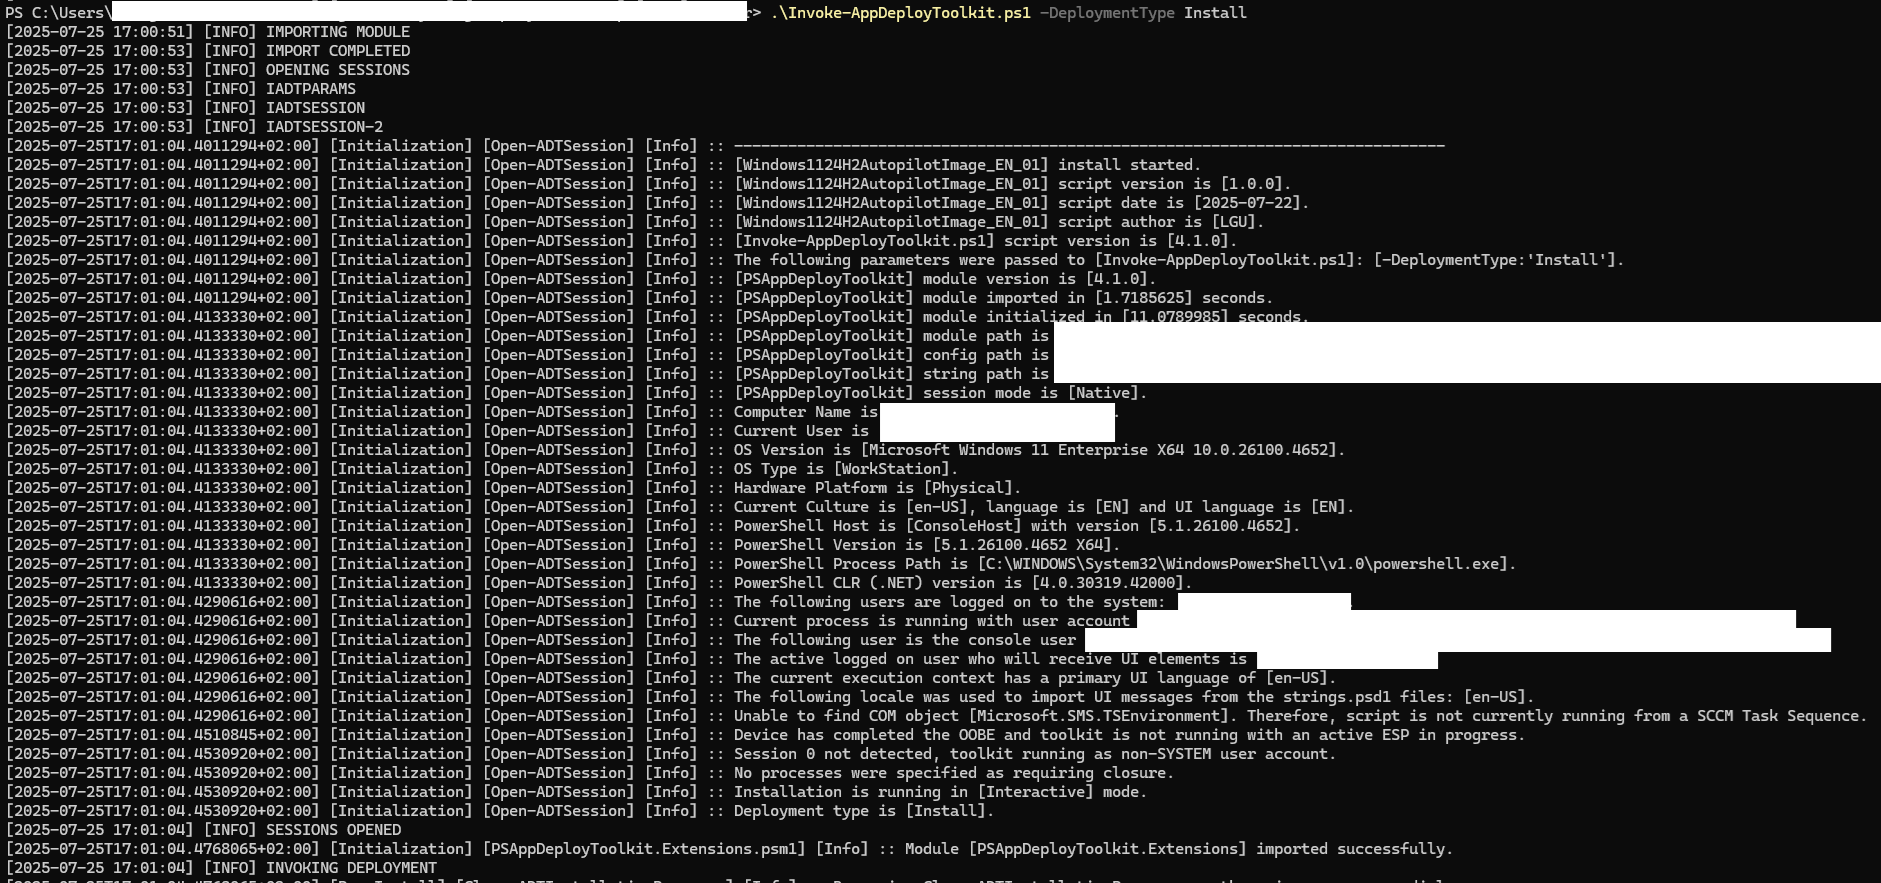
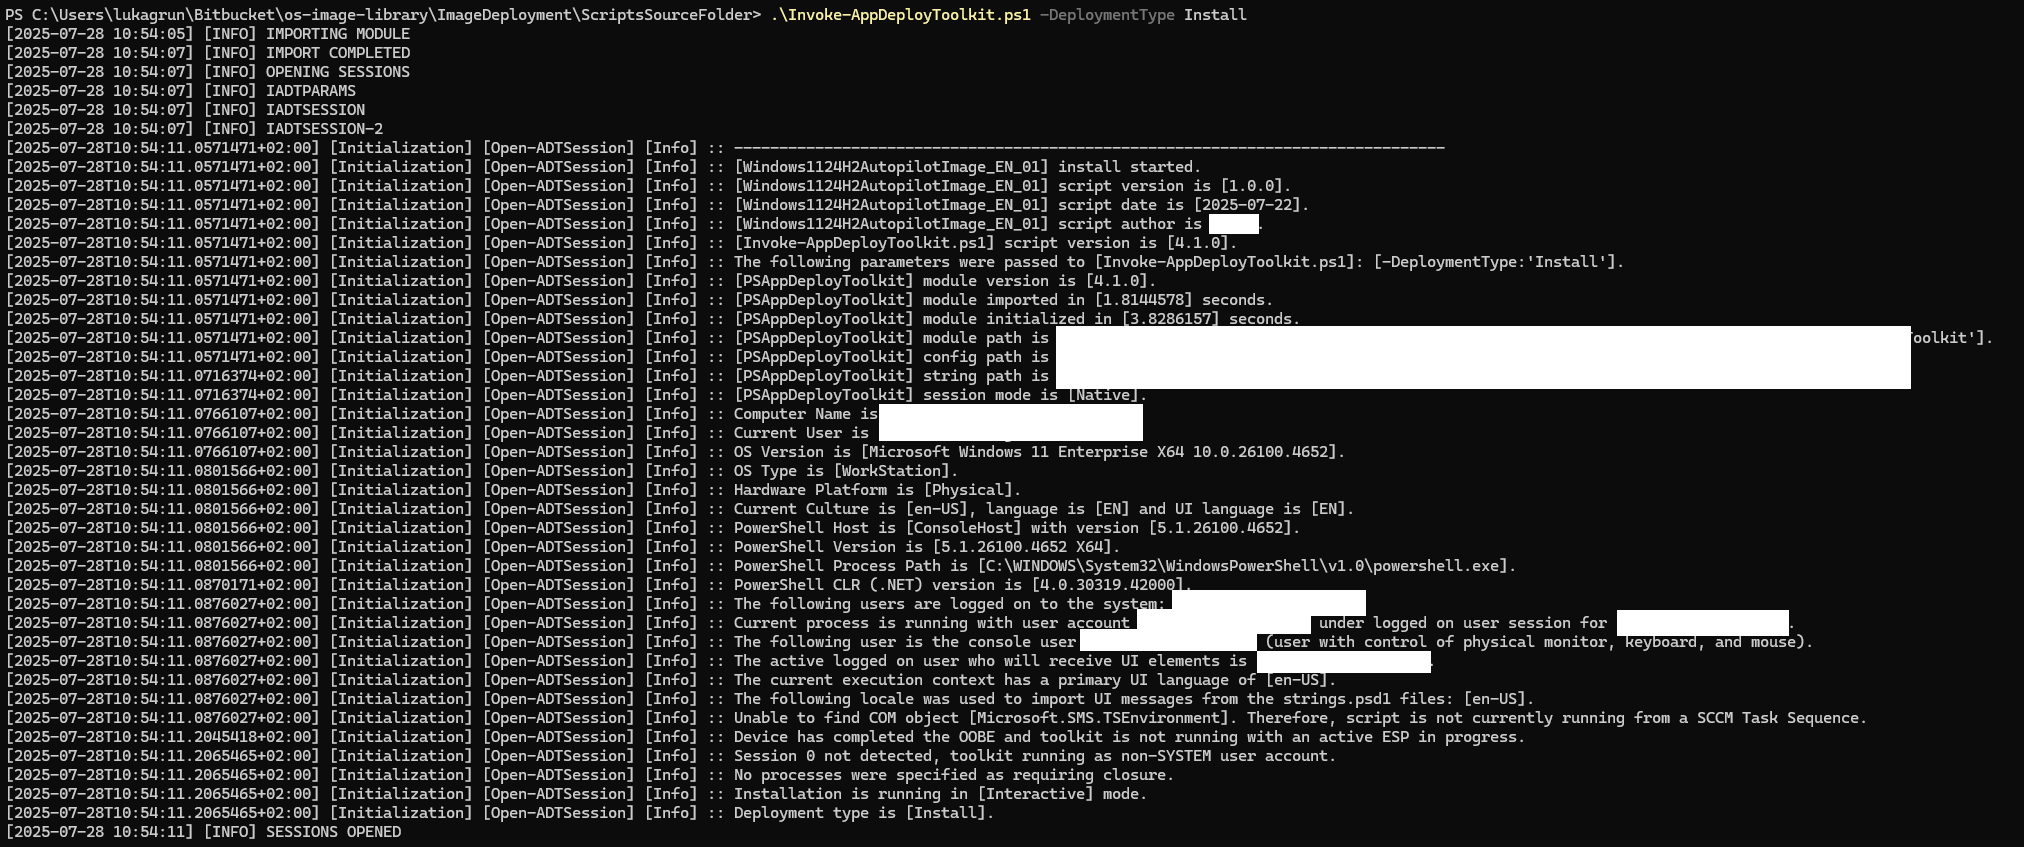
So I added some write-outputs in the ps code and it seems that module import takes like 2 seconds, which is fine, but opening the session:
Is this “normal” ? I feel like it’s kinda of problem, because since the session is not running these 15 seconds I can’t even use some function to call pop up that would say “Please wait, loading…” to the user.
Is this just 4.0 version issue ?
Can I do anything to get this down to 3-5 seconds?
In your session logs on screen, how long does it say that module import and module initialisation took? On my system, it typically takes <1 second to initialise. We are looking at removing a number of WMI calls in the future though which will help here.
It’ll likely be in New-ADTEnvironmentTable, but it’ll be good to be sure.
Editing to add this screenshot. This is off my development VM, but module initialisation times for me are always <0.75 seconds which is why it’d be good for you to run the profiler so we can see where the slow source is for you.
The problem here is you’re profiling everything, but I’d just profile Open-ADTSession or Initialize-ADTModule to find out what’s going wrong specifically during the initialisation.
These are pretty good times! They’re probably better on the whole than I get on my VM I develop from.
I’d say it’s possibly something to do with production machines having scriptblock logging enabled, it can drastically slow down performance. We actively avoid ForEach-Object and Where-Object to try and eliminate the performance issues with scriptblock logging, but its probably not bulletproof. Have a read of this great article for more info: Speeding Up the Pipeline - powershell.one
We’re doing things to make things after for 4.2.0 by reducing the amount of WMI calls, and while it should give an improvement, it may not necessarily resolve this issue on your prod devices.
Yep it’s definitely issue specific to my device, probably one of three things.
I have Delinea configured on my laptop, for permission elevation
Crowdstrike Falcon sensor
I have Intel Core Ultra 7 165H processor, it’s set to max performance and the efficiency cores are disabled, but there are still 2 special efficiency cores that can’t be disabled, not sure it’s possible that it could get scheduled to those
But one thing to note on fresh VM, is that it does run these very nice times I mentioned, but not on the first run after restart (even if I let the VM sit for 15 minutes after start, to let everything settle), the first run is always around following numbers:
[2025-07-30T12:46:52.5743296+02:00] [Initialization] [Open-ADTSession] [Info] :: [PSAppDeployToolkit] module version is [4.1.0].
[2025-07-30T12:46:52.5743296+02:00] [Initialization] [Open-ADTSession] [Info] :: [PSAppDeployToolkit] module imported in [3.3508105] seconds.
[2025-07-30T12:46:52.5743296+02:00] [Initialization] [Open-ADTSession] [Info] :: [PSAppDeployToolkit] module initialized in [2.8381122] seconds.
while the rest, for example from today’s testing is like:
The first execution on a cleanly booted machine will always be the slowest because nothing’s loaded within the GAC until it’s ran once. It’s definitely normal though.